
Zabbix 5.2 - Why it's worth upgrading
Zabbix 5.2 has been released a few weeks ago and brought several improvements that increase management capabilities and support more granular control. A new set of triggers provide a whole new spectrum of alerting in assocation with host specific trends!
Zabbix 5.2 has been released a few weeks ago and brought several improvements that increase management capabilities and support more granular control. A new set of triggers provide a whole new spectrum of alerting in assocation with host specific trends!
Dynamic thresholds using history data
I'll start with the most important feature first - just because i'm so happy that it's finally here.
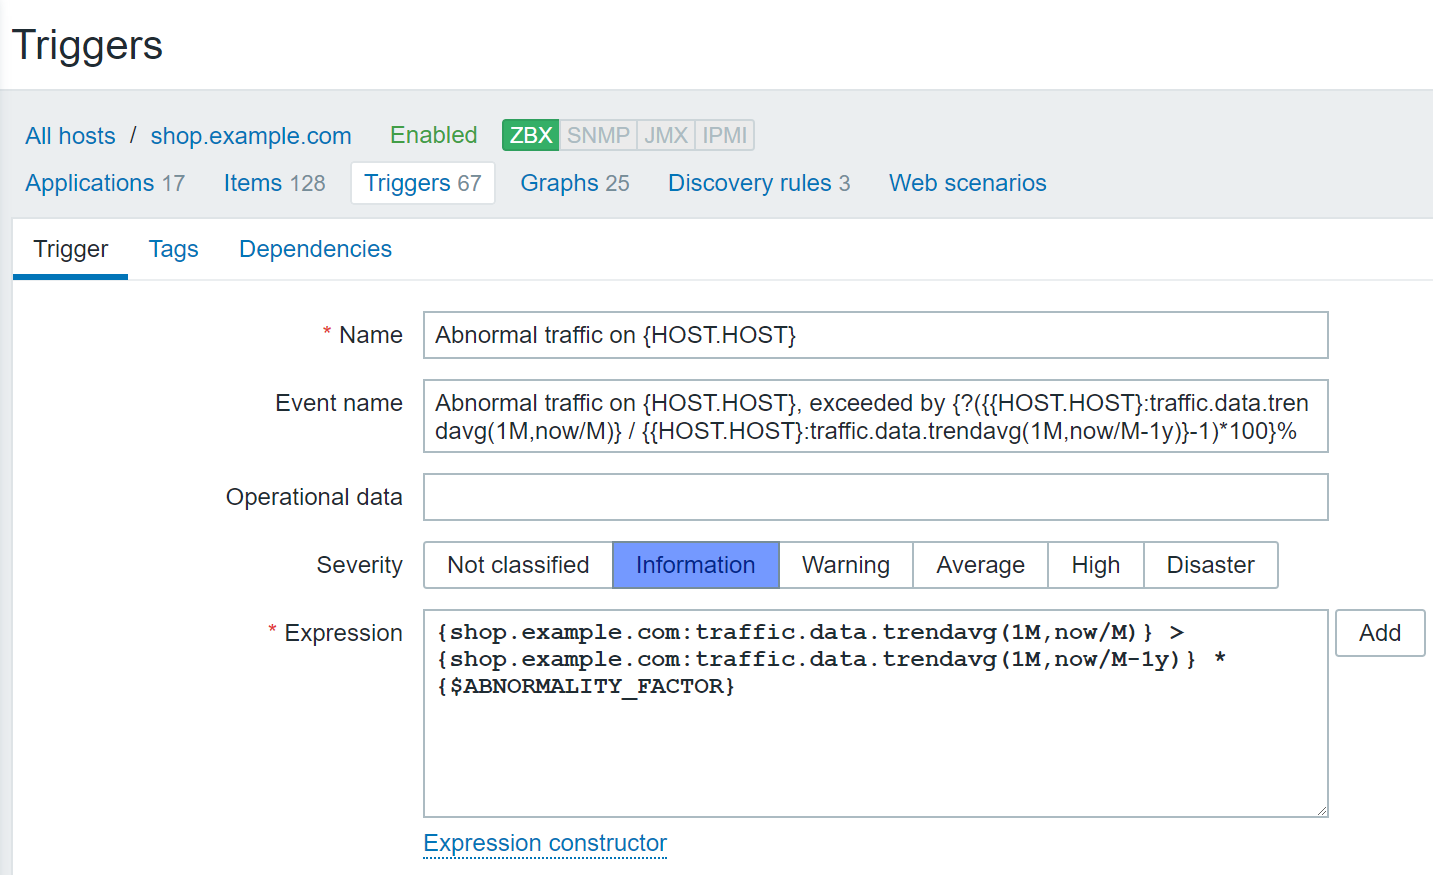
I want to create an alert when the CPU utilization of a host increases from one month to another by more than 20%.
Thanks to a bunch of new trigger functions that allow to compare data over longer time periods by accessing the trend values.
- trendavg - average of trend values for period
- trendcount - count of trend values for period
- trenddelta - delta of min/max trend values for period
- trendmax - maximum of trend values for period
- trendmin - minimum of trend values for period
- trendsum - sum of trend values for period
Why should i use dynamic thresholds?
When monitoring a larger set of hosts it's hard to find thresholds that match multiple hosts. And maybe it's not always important to get a notification when a host exceeds some critical threshold - it might be worth noticing when the system has some sort of degression over time.
Best example here is to watch the latency of a disk - you may create a notification when it get's really bad. But for what type of disk? HDD, SSD or NVMe? It depends! Using dynamic values it's good to create an alert when the latency increases on average values from one month to another - having similar workload this might be an indicator for a disk getting corrupt (or increasing workload).
This is not meant to be a replacement for static thresholds - having a host with average CPU load of more than 95% is never good :-) Sometimes it's just useful to detect when systems change behaviour over time.
Background: Why it's important to use trend triggers
Depending on your knowledge about zabbix internals you are aware that zabbix collects data and writes it into history tables - these contain the exact data. But - here's the point: Collecting data like memory utilization with a value each 30s results in 720 data points - per day, per host. While processing triggers means mostly you acccess data generated within the last few minutes, hours or days there's no need to keep each measured value forever. Therefore zabbix uses trend values that provide an intermediate value that is used when generating graphs. Mostly you won't notice this at all.
Depending on your setup housekeeper or table cleanups (when working with partitioning) will delete old history values. Working on triggers that may use average values over a longer timeframe (like three months) makes therefore sense when it's accessing the trend data which is typically stored for about six to twelve months.
Stored views
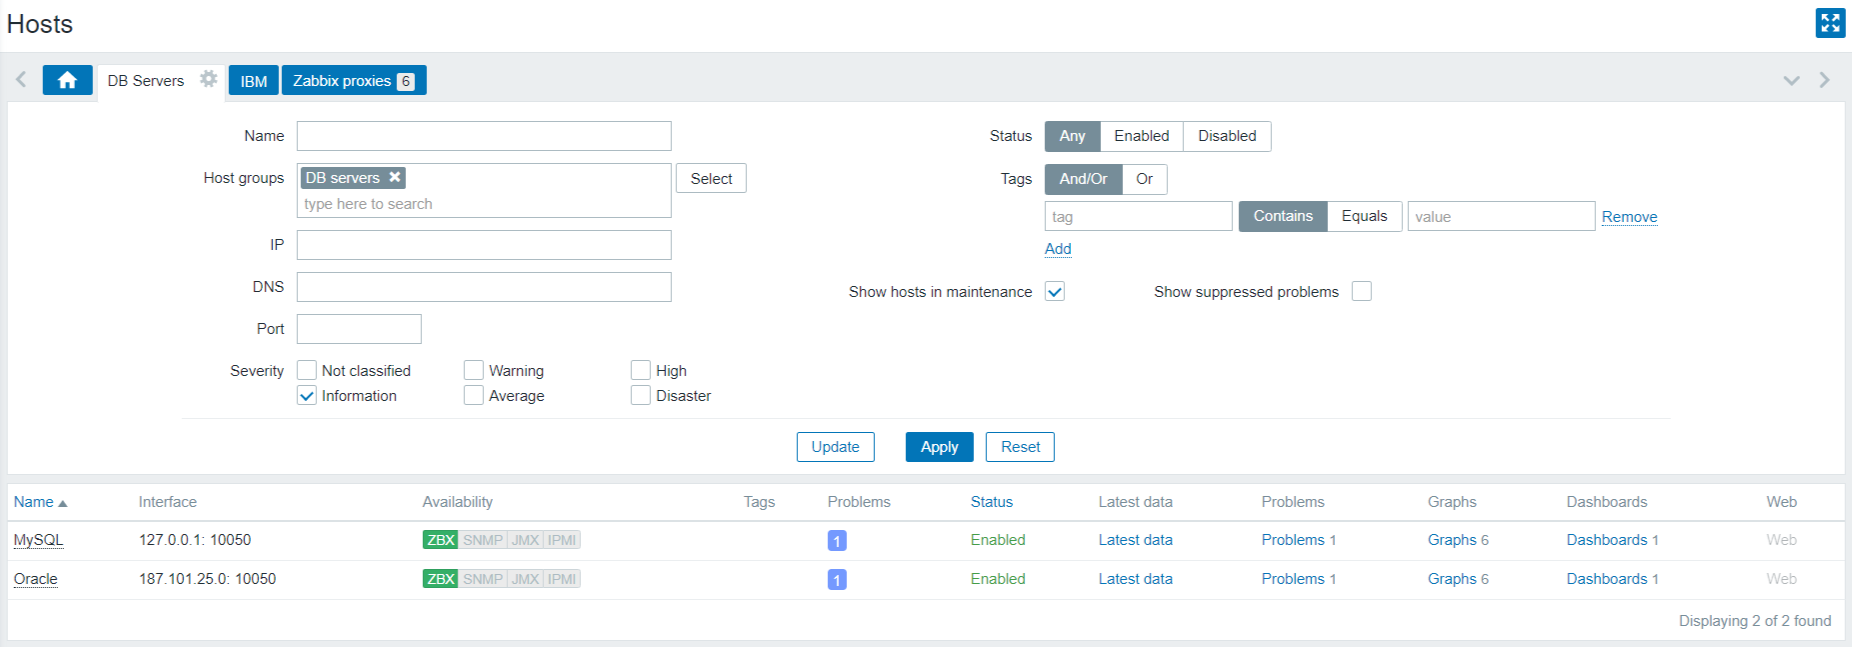
This is one thing propably every user knows: You've some sort of views and filters of some of the zabbix views you're using and you need to switch between them. Luckily Zabbix 5.2 offers the ability to save custom views with all your filters applied and allows you to easily switch between them.
This feature is supported on the following views:
- Monitoring - Hosts
- Monitoring - Problems
Script item type
Sometimes monitoring with simple item or API requests is not enough and you just need to provide a more complex logic to get the values you need. If this is one of your needs, you should upgrade to Zabbix 5.2 - there's a new item type that may help you here.
Using this item type you can provide javascript code that will be executed and has to return the value(s) you want to monitor. Obviously this is useful when you're monitoring some host using HTTP/HTTPS requests. An example for a very simple script would be:
var request = new CurlHttpRequest();
return request.Get("https://blog.nuvotex.de/rss/");Using makros and parameters you may of course pass values into your script - which is important if you're working with templates instead of items directly tailored to specific hosts.
Notice: Script item types are executed on Zabbix Server or Proxies - so make sure the executing host has access to the required resources.
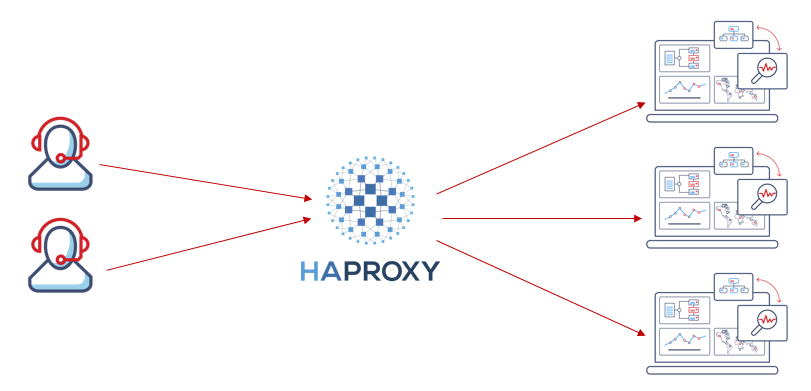
Frontend & API scaling
Depending on the size of your zabbix installation you may be happy to see this feature. Zabbix provides the ability to scale the frontend & API components across multiple nodes with HTTP load balancing. This is perfectly suited to run the frontend components either on dedicated machines or scale out using some container environment like docker swarm oder kubernetes which offer easy scaling depending on your needs while avoiding additional efforts for keeping things up to date.
Despite these features mentionend here, Zabbix 5.2 is a big release that offers even more.
- User roles provide more granular access control
- Optional host interfaces (especially useful when working with API monitoring)
- Modbus and MQTT support opens up Zabbix for IoT monitoring
- YAML format for template export/import
- Support for external storage vault (storing secrets in HashiCorp Vault)
The zabbix team is also working in adding more and more templates to provide useful monitoring templates ouf ot the box - this is especially useful to users with less experience that want to get an easier onboarding.
Read the full release notes here:


