

Writing efficient zabbix templates - consolidate values
Getting useful insights with your monitoring solution means you need to gather enough information that can be used to draw the right conclusions. This article will show how to retrieve vast amounts of data without overloading your monitoring system.
Getting useful insights with your monitoring solution means you need to gather enough information that can be used to draw the right conclusions.
Retrieving many values means - in classical understanding of zabbix - that many values need to be retrieved from the agents. This introduces a roundtrip for every value, implies (on zabbix-agent2) scheduling the gathering process and so on. Besides the many roundtrips, retrieved values are not from the same time (like when retrieving disk values of many disks on the same system).
Let's do this better!
One of the most powerful features of zabbix at this place is (as time of writing) the use of dependent items. This article will cover an example of how to improve the efficiency of monitoring logical disk performance data on a windows agent while providing more accurate data on the results.
Gathering all data with a single roundtrip
Our goal will be go retrieve all data with a single value and use this data for discovery and retrieval of actual values afterwards.
Let's create an item.
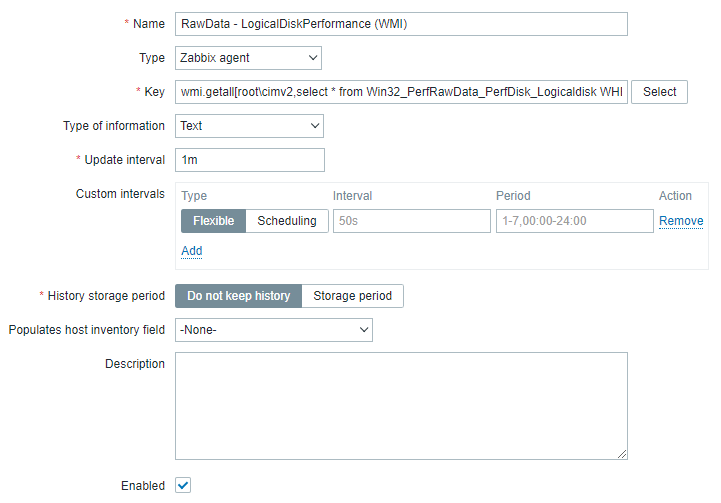
The exact key of the item is: wmi.getall[root\cimv2,select * from Win32_PerfRawData_PerfDisk_Logicaldisk WHERE NOT Name='_Total']
This item will retrieve all fields of Win32_PerfRawData_PerfDisk_Logicaldisk (please note that we're using PerfRawData). As we're expecting larger values we'll need to set the type to text. We don't need to retrieve the _Total virtual counter value as we're gathering data on each object itself - so we're excluding it to reduce the amount of transferred data.
And after all, we'll make to sure do not keep history. This is important because storing this data will otherwise fill up our database with data we won't use anymore. This item has only the purpose to provide a value retrieval on which other items will depend on.
Let's save this and continue.
An example value will look like this:
[
    {
        "AvgDiskBytesPerRead": "8433852416",
        "AvgDiskBytesPerRead_Base": 33415,
        "AvgDiskBytesPerTransfer": "8451026944",
        "AvgDiskBytesPerTransfer_Base": 34681,
        "AvgDiskBytesPerWrite": "17174528",
        "AvgDiskBytesPerWrite_Base": 1266,
        "AvgDiskQueueLength": "1382343708",
        "AvgDiskReadQueueLength": "1377336273",
        "AvgDisksecPerRead": 1377336273,
        "AvgDisksecPerRead_Base": 33415,
        "AvgDisksecPerTransfer": 1382343708,
        "AvgDisksecPerTransfer_Base": 34681,
        "AvgDisksecPerWrite": 5007435,
        "AvgDisksecPerWrite_Base": 1266,
        "AvgDiskWriteQueueLength": "5007435",
        "CurrentDiskQueueLength": 0,
        "DiskBytesPersec": "8451026944",
        "DiskReadBytesPersec": "8433852416",
        "DiskReadsPersec": 33415,
        "DiskTransfersPersec": 34681,
        "DiskWriteBytesPersec": "17174528",
        "DiskWritesPersec": 1266,
        "FreeMegabytes": 130201,
        "Frequency_Object": "0",
        "Frequency_PerfTime": "10000000",
        "Frequency_Sys100NS": "10000000",
        "Name": "C:\\\\mount\\\\data0",
        "PercentDiskReadTime": "1377336273",
        "PercentDiskReadTime_Base": "132707218106465698",
        "PercentDiskTime": "1382343708",
        "PercentDiskTime_Base": "132707218106465698",
        "PercentDiskWriteTime": "5007435",
        "PercentDiskWriteTime_Base": "132707218106465698",
        "PercentFreeSpace": 130201,
        "PercentFreeSpace_Base": 524158,
        "PercentIdleTime": "263635159646",
        "PercentIdleTime_Base": "132707218106465698",
        "SplitIOPerSec": 147,
        "Timestamp_Object": "0",
        "Timestamp_PerfTime": "264260598447",
        "Timestamp_Sys100NS": "132707218106465698"
    },
    {
        "AvgDiskBytesPerRead": "2607154176",
        "AvgDiskBytesPerRead_Base": 104009,
        "AvgDiskBytesPerTransfer": "4510500864",
        "AvgDiskBytesPerTransfer_Base": 220653,
        "AvgDiskBytesPerWrite": "1903346688",
        "AvgDiskBytesPerWrite_Base": 116644,
        "AvgDiskQueueLength": "5948021666",
        "AvgDiskReadQueueLength": "1899480456",
        "AvgDisksecPerRead": 1899480456,
        "AvgDisksecPerRead_Base": 104009,
        "AvgDisksecPerTransfer": 1653054370,
        "AvgDisksecPerTransfer_Base": 220653,
        "AvgDisksecPerWrite": 18446744073463125530,
        "AvgDisksecPerWrite_Base": 116644,
        "AvgDiskWriteQueueLength": "4048541210",
        "CurrentDiskQueueLength": 0,
        "DiskBytesPersec": "4510500864",
        "DiskReadBytesPersec": "2607154176",
        "DiskReadsPersec": 104009,
        "DiskTransfersPersec": 220653,
        "DiskWriteBytesPersec": "1903346688",
        "DiskWritesPersec": 116644,
        "FreeMegabytes": 43133,
        "Frequency_Object": "0",
        "Frequency_PerfTime": "10000000",
        "Frequency_Sys100NS": "10000000",
        "Name": "C:",
        "PercentDiskReadTime": "1899480456",
        "PercentDiskReadTime_Base": "132707218106465698",
        "PercentDiskTime": "5948021666",
        "PercentDiskTime_Base": "132707218106465698",
        "PercentDiskWriteTime": "4048541210",
        "PercentDiskWriteTime_Base": "132707218106465698",
        "PercentFreeSpace": 43133,
        "PercentFreeSpace_Base": 71327,
        "PercentIdleTime": "260635543661",
        "PercentIdleTime_Base": "132707218106465698",
        "SplitIOPerSec": 21060,
        "Timestamp_Object": "0",
        "Timestamp_PerfTime": "264260598447",
        "Timestamp_Sys100NS": "132707218106465698"
    }
]Creating the discovery rule
As we're retrieving a whole bunch of data now, we'll use this by creating a discovery on this item.
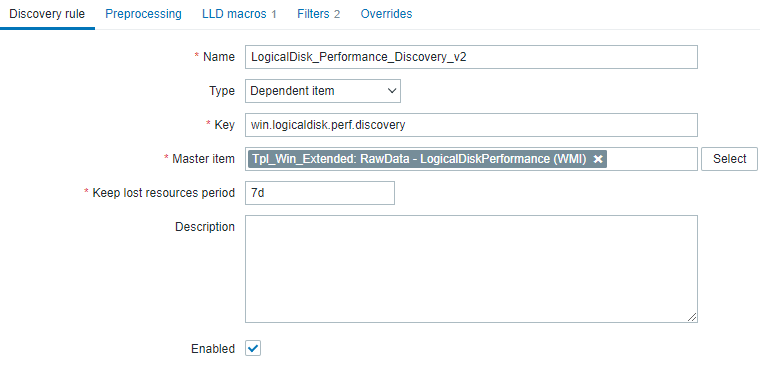
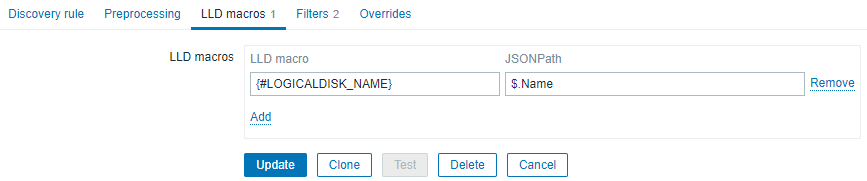
This rule is built using a dependent item - using LLD macros we're exracting a single makro (the name) that we'll use on discovery.
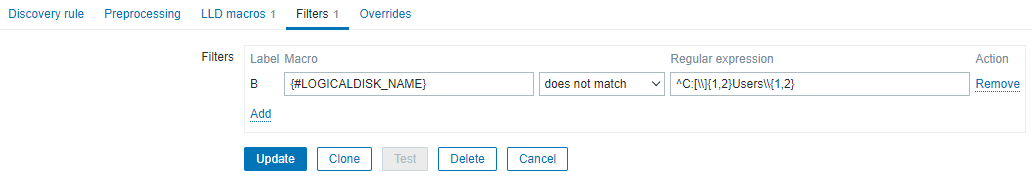
Some filters will prevent us from discoverying disks that are attached on C:\Users (which is used by remotedesktopenvironments when using user profile disks).
Creating a discovery root item
Our newly created discovery rule will be invoked whenever a new value of the base item is retrieved (in this example: every minute). To extract values on discovered items easily, we'll create an intermediate raw item that will extract the current object of the base item within the scope of a discovered item.
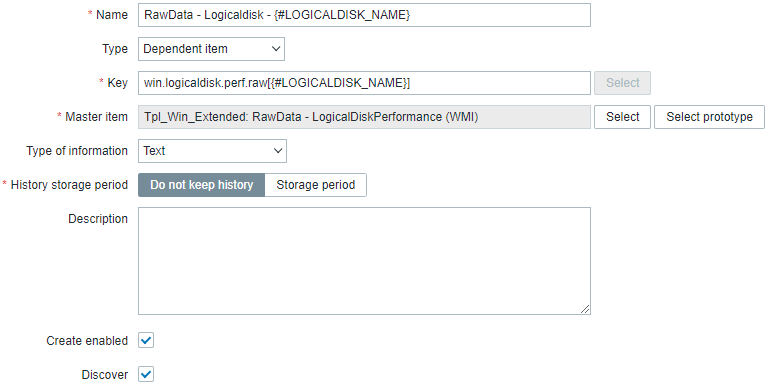
We're creating just another dependent item on the base item and using Preprocessing with a JavaScript step. On the item itself make sure to not keep history - this is yet another intermediate item for easier processing.
Preprocessing
The important stuff happens on preprocessing here - we're extracting our current disks data as a single object from the base item.
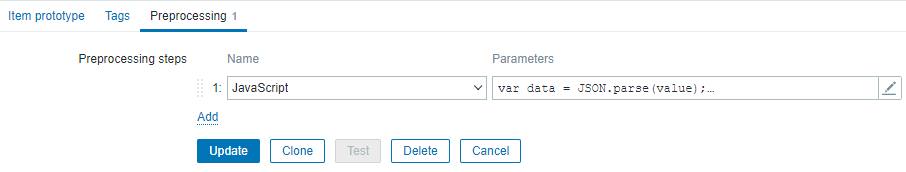
The script looks like this:
var data = JSON.parse(value);
for(var i = 0; i < data.length; ++i){
 if(data[i].Name.replace(/\\\\/g,"\\") == "{#LOGICALDISK_NAME}"){
  return JSON.stringify(data[i]);
 }
}
throw "Item not found";
We're parsing the value as JSON string and iterating over it until we've a match on the disk name. As we're supporting ntfs mount paths, we need to do some ugly replacement of string escapes here - otherwise we won't match with the name.
If we're not finding a matching object, we're failing with an exception - the only reasonable thing to do here.
Testing with the value above will show that everything works as expected:
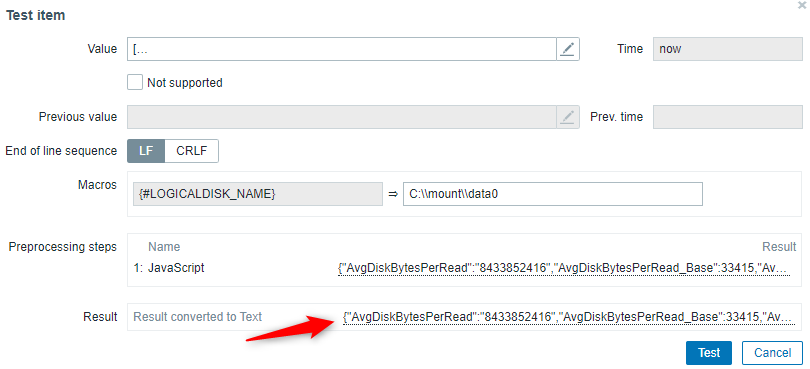
The extracted value is now a single object and no longer an array.
Creating the actual metrics items
As we're having a single object at our fingertips right now, we're able to create items based on this.
An example of such a value would be the total number of read bytes on a logical disk.
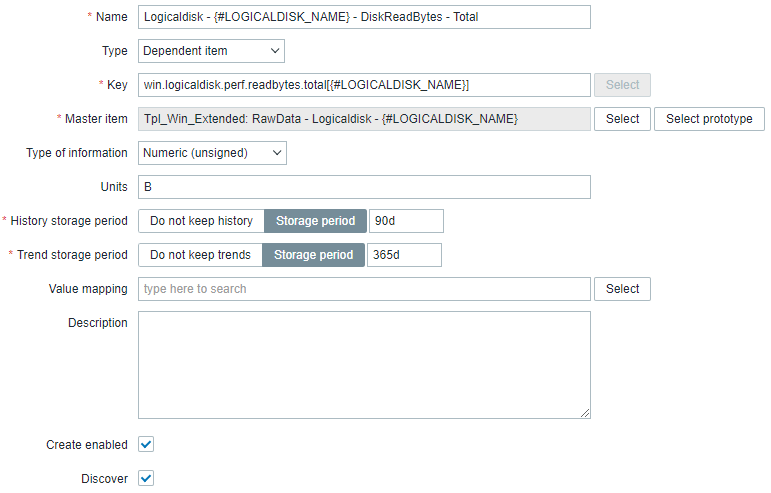
The item is based on our discover-local raw item (we've created right before) and using JSONPath to extract the value of a single field.
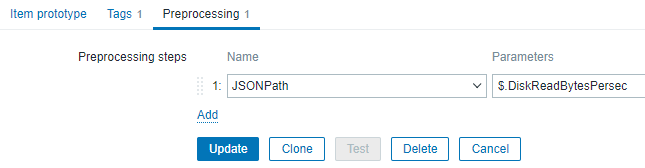
Well - that's it. We've just create a value by solely creating a dependent item and extracting the JSONpath.
A full fledged template might look like this:
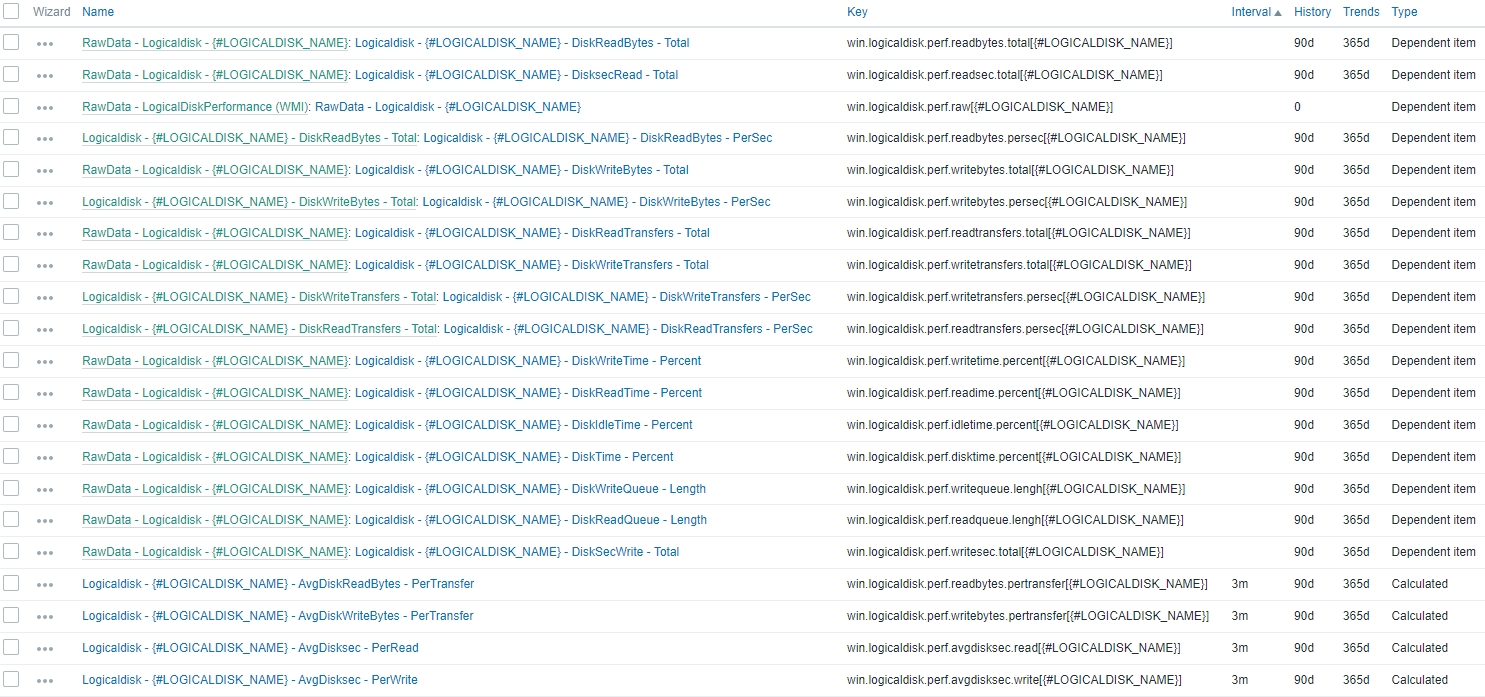
There's some more recursion on items (like on DiskReadBytes - PerSec that inherits DiskReadBytes - Total and applies ChangePerSec). But at it's core there's just a bunch of items that are extracting data using JSONpath.
Make sure to limit the amount of data
Some of you might have added up the numbers in your mind: Fetching a single base item every minute runs a discovery for every record which will extract 16 additional persistent values. How can i prevent of retrieving data too often?
Well - that's the point when working with dependant item. Every object is updated whenever the base item is updated. If you're extracting static values (like physical disk firmware, size, etc.) it's strongly recommended to apply a rate limiting on these values using the Discard unchanged with heartbeat preprocessor. This will limit the amount of data that is actually persistet while still maintaining updating the value right when it actually changed. Isn't that great?
Conclusion
As it shows, it's quite easy to rewrite your templates and reduce the amount of roundtrips to your agents. In this case we've seen that a system with three logical disks would have 48 values per minuten if each value is retrieved as a single request. Discovery might be scheduled once every 15 to 30 minutes. Building the gathering process on a single base item, we're reducing the roundtrips to one per minute - this actual amount of data transferred is more, that's obvious. If you're using a large portion of the data that is retrieved, this will outweigh the benefits of reducing the roundtrips.
As a side effect all data is from the exact same timestamp and provides better insights. The overall gathering process of zabbix internal is reduced in it's complexity (less scheduling, more reactive).
So let's build some efficient templates!


