

The case of HTTP2 protocol error and chromium net-log
Migrating some of our internally used services to a new reverse proxy layer i've been struggling with ERR_HTTP2_PROTOCOL_ERROR when accessing a migrated service.
Migrating some of our internally used services to a new reverse proxy layer i've been struggling with ERR_HTTP2_PROTOCOL_ERROR when accessing a migrated service.
Our reverse proxy layer is running nginx and forwarding to our orchestration layer (in this case docker swarm). External and internal connections are encrypted using https.
Problem description
The error occured when accessing the migrated services from chromium based browsers (like chrome or edge). Connectivity using firefox has been working fine.
Verifying the connections showed quickly that firefox has just been using http1.1 when connecting whereas chromium used http2.
The error code showed by chromium has been: ERR_HTTP2_PROTOCOL_ERROR

Well, that's not very much. Checking out the nginx logs showed that response has been sent correctly (http 200). Having successful connectivity using http1.1 connections didn't seem that the problem has been located on the upstream.
Getting more details
The key to solve this issue has been to use net-export. This provides the ability to capture events related to network activity and errors occuring there.
Generate netlog
Generating the log is straight forward.
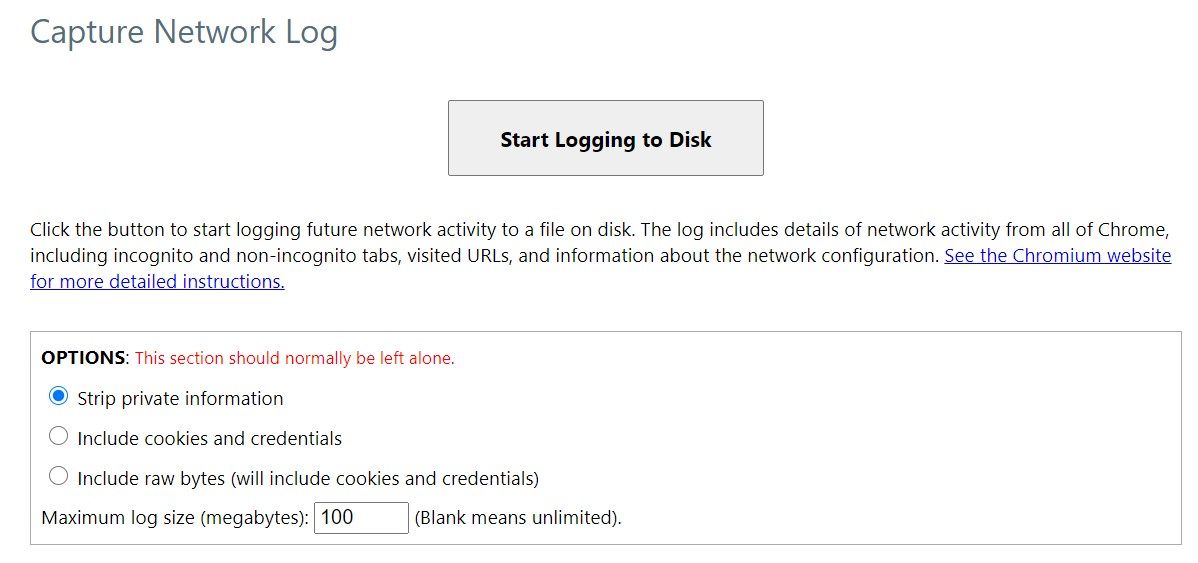
- Open a new browser (that should only contain a single tab)
- Open net-export tool: chrome://net-export/ (copy & paste link)
- Start log
- Reproduce the error
- Stop log
View log
Having generated a log, navigate to netlog-viewer (https://netlog-viewer.appspot.com/#import) and open the log file.
This will show the contents of the log.
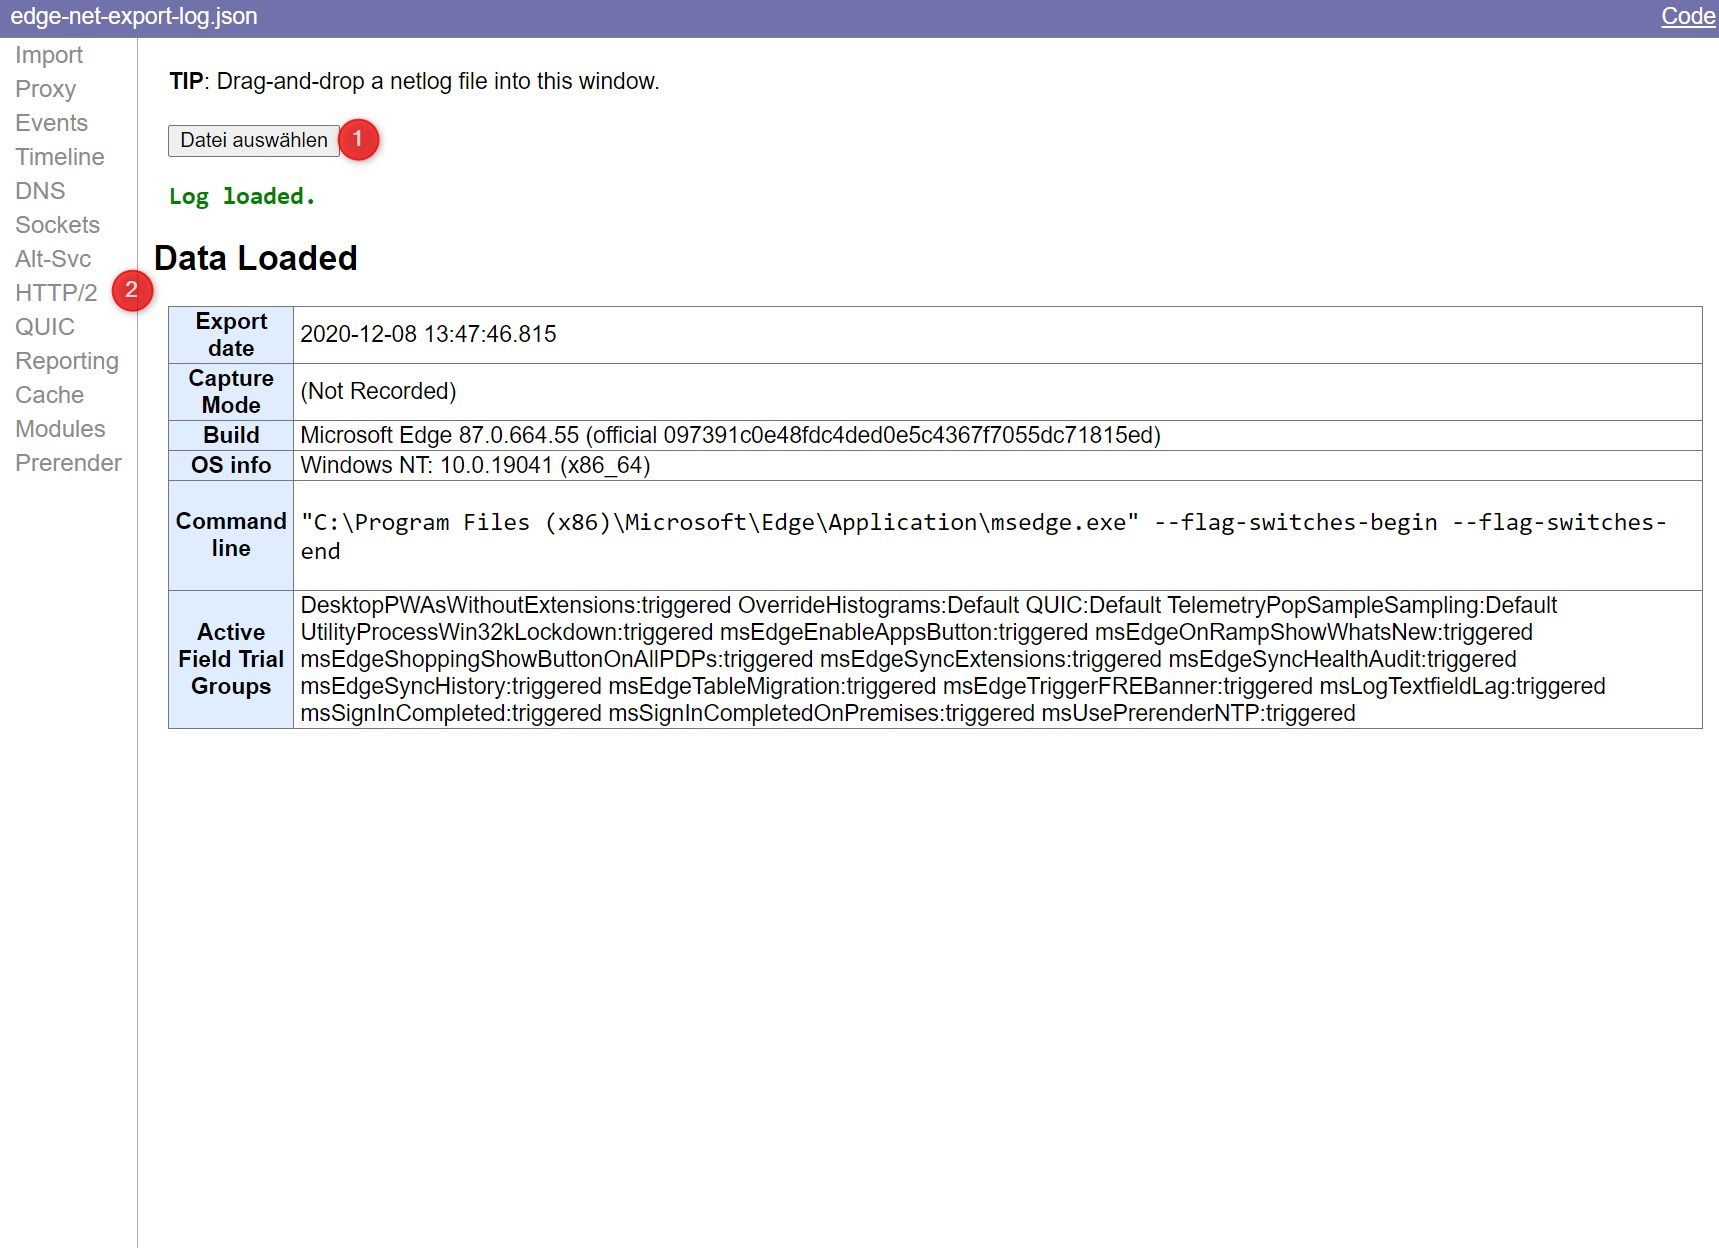
Navigate to HTTP/2 and find the session of interest.
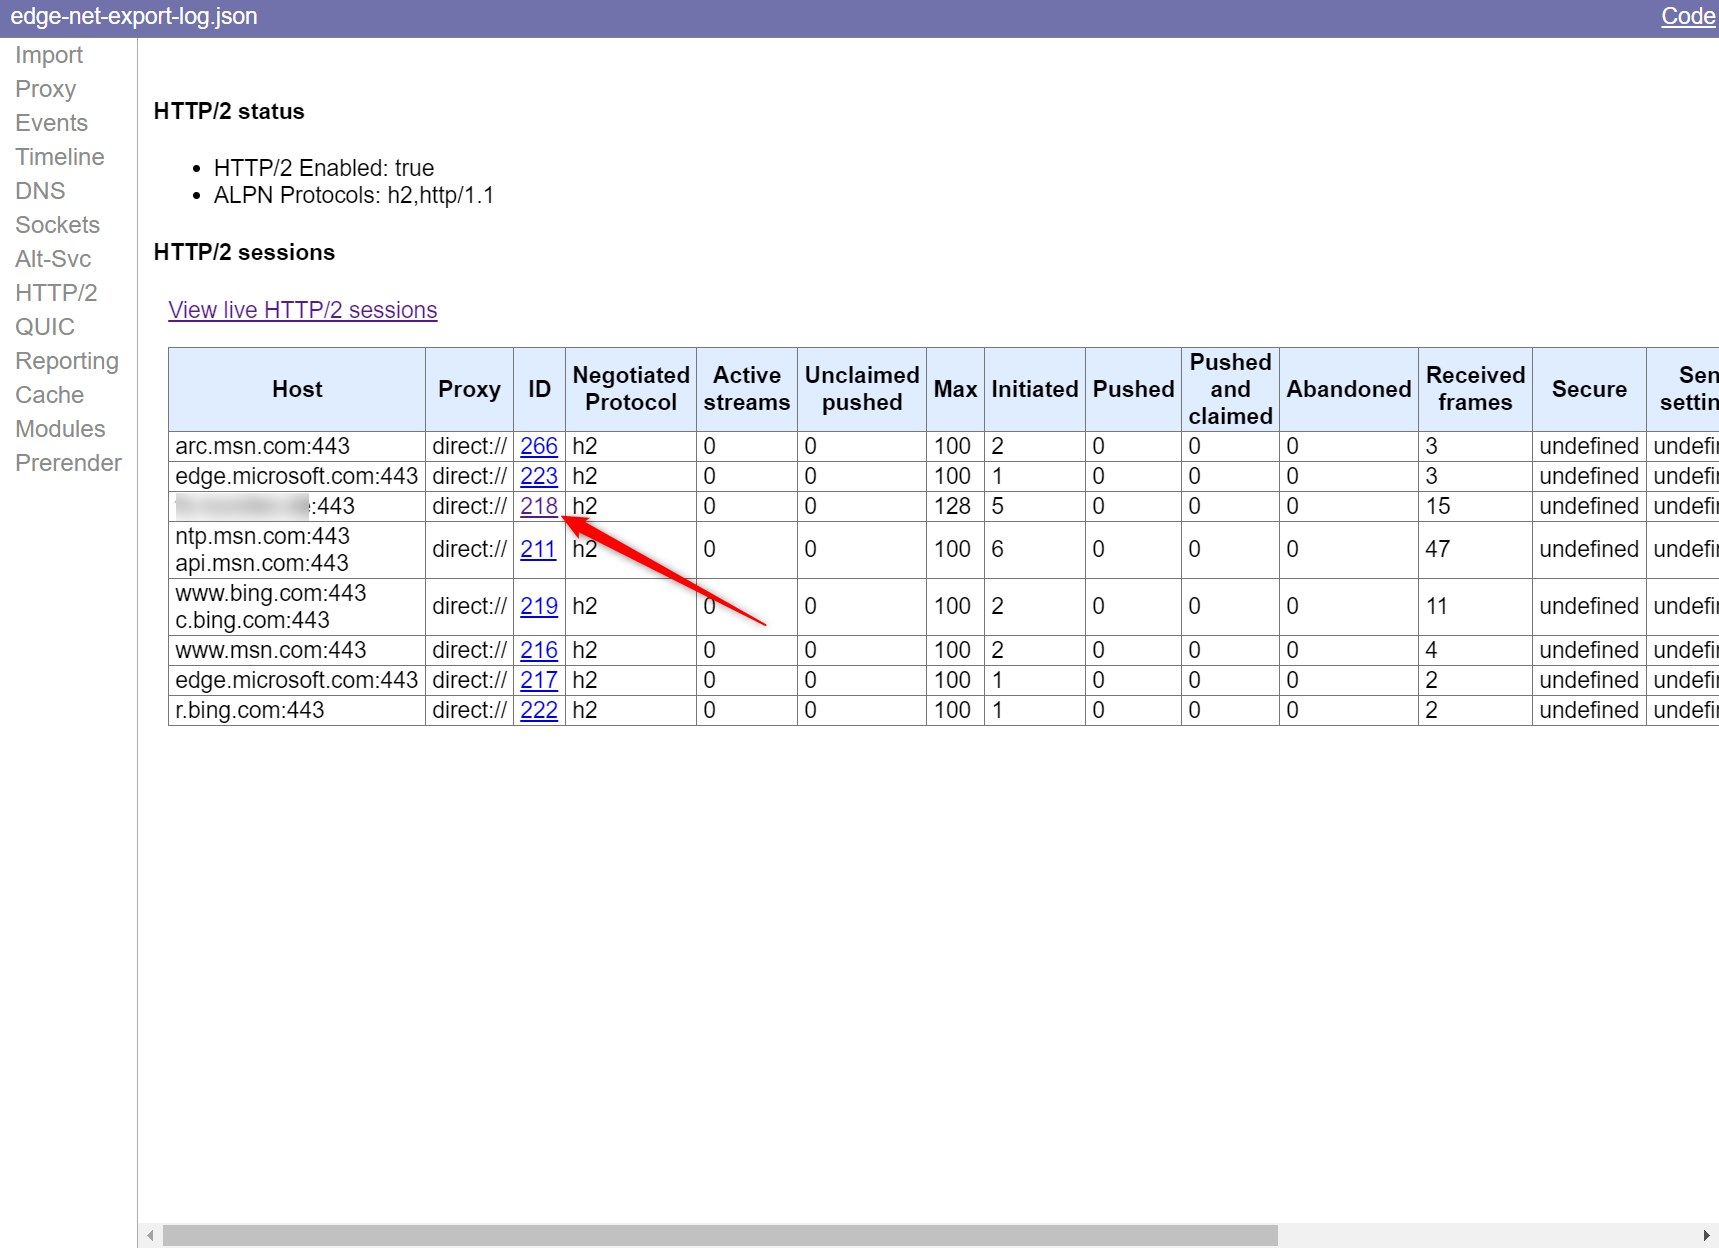
Clicking the ID will apply a filter on the viewer and lead you to the associated session record.

The actual record data shows relevant information:
218: HTTP2_SESSION
Start Time: 2020-12-08 13:46:05.015

t= 2 [st=101733]  HTTP2_SESSION_PING
                  --> is_ack = false
                  --> type = "sent"
                  --> unique_id = 2
t= 2 [st=101733]  HTTP2_SESSION_SEND_HEADERS
                  --> exclusive = true
                  --> fin = true
                  --> has_priority = true
                  --> :method: GET
                      :authority: example.com
                      :scheme: https
                      :path: /login
                      cache-control: max-age=0
                      upgrade-insecure-requests: 1
                      user-agent: Mozilla/5.0 (Windows NT 10.0; Win64; x64) AppleWebKit/537.36 (KHTML, like Gecko) Chrome/87.0.4280.67 Safari/537.36 Edg/87.0.664.55
                      accept: text/html,application/xhtml+xml,application/xml;q=0.9,image/webp,image/apng,*/*;q=0.8,application/signed-exchange;v=b3;q=0.9
                      sec-fetch-site: none
                      sec-fetch-mode: navigate
                      sec-fetch-user: ?1
                      sec-fetch-dest: document
                      accept-encoding: gzip, deflate, br
                      accept-language: de,de-DE;q=0.9,en;q=0.8,en-GB;q=0.7,en-US;q=0.6
                      cookie: [69 bytes were stripped]
                  --> parent_stream_id = 0
                  --> source_dependency = 487 (HTTP_STREAM_JOB)
                  --> stream_id = 9
                  --> weight = 256
t=17 [st=101748]  HTTP2_SESSION_PING
                  --> is_ack = true
                  --> type = "received"
                  --> unique_id = 2
t=68 [st=101799]  HTTP2_SESSION_RECV_INVALID_HEADER
                  --> error = "Invalid character 0x0A in header value."
                  --> header_name = "strict-transport-security"
                  --> header_value = "max-age=15768000;\n\t# includeSubDomains; preload;"
t=68 [st=101799]  HTTP2_SESSION_SEND_RST_STREAM
                  --> description = "Could not parse Spdy Control Frame Header."
                  --> error_code = "1 (PROTOCOL_ERROR)"
                  --> stream_id = 9
t=68 [st=101799]  HTTP2_SESSION_RECV_DATA
                  --> fin = false
                  --> size = 3460
                  --> stream_id = 9
t=69 [st=101800]  HTTP2_SESSION_UPDATE_RECV_WINDOW
                  --> delta = -3460
                  --> window_size = 15725180
t=69 [st=101800]  HTTP2_SESSION_UPDATE_RECV_WINDOW
                  --> delta = 3460
                  --> window_size = 15728640
t=69 [st=101800]  HTTP2_SESSION_RECV_DATA
                  --> fin = true
                  --> size = 0
--> stream_id = 9Read the trace carefully, there's no highlighting for errors (as of today). You may see that there's an issue shown HTTP2_SESSION_RECV_INVALID_HEADER. This will lead us directly to the actual error: Invalid character 0x0A in header value.
Therefore our solution is to fix the incorrect header that has been set on the upstream (in our case a header has not been terminated correctly) and right afterwards it works flawless.
Why only with http2?
For quite some while i've excluded some components (like headers) as an error source - http1.1 (provided by old access path) has been working fine. And headers are the same, right?
Chromium introduces a more strict header parsing when connecting using http2 (which won't break stuff that has been working before).
Lesson learned: Easiest way to diagnose into connection issues is to use the netlog that may be created using tools provided already with chromium based browsers.


