

What happens if you ask kubernetes for 1254051 replicas
One of our playgrounds recently had an incident which caused control-plane to go out-of-memory. This article shows how to diagnose and especially how to fix or event prevent this.
To play around with kubernetes and onboard new colleagues into the topic, we're using lab environments. One of these is a self-hosted kubernetes cluster. Nothing special, HA control plane (three nodes), three worker nodes.
Beginning of the failure state
Last week the cluster went into an unresponsive state, where control planes started to crash - to be more precise, the API servers went crazy. It was barely possible to manage the nodes.
Checking out the system utilization, it was quite clear that we had exhaustion on memory and very high CPU utilization.
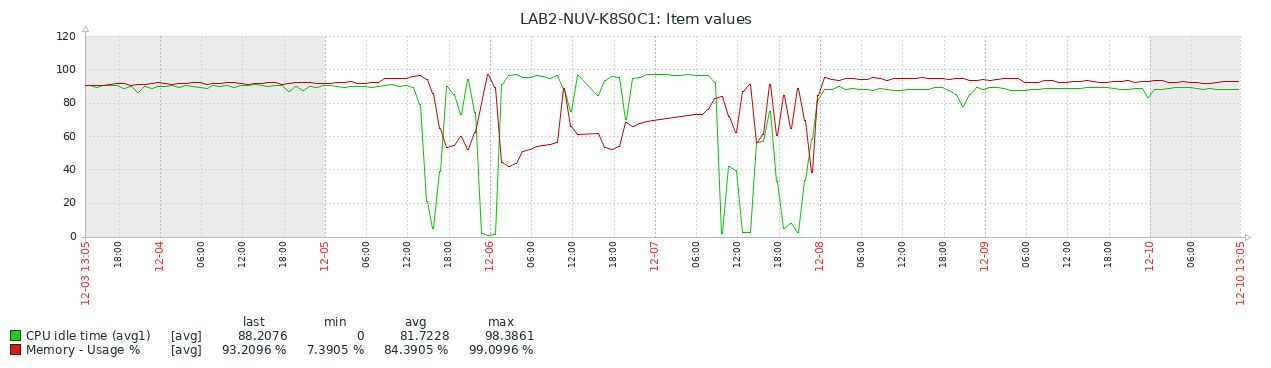
You can see, that with increasing memory, CPU idle time reduced. Checking more into detail revealed, that we're waiting for I/O (which stalls CPU).
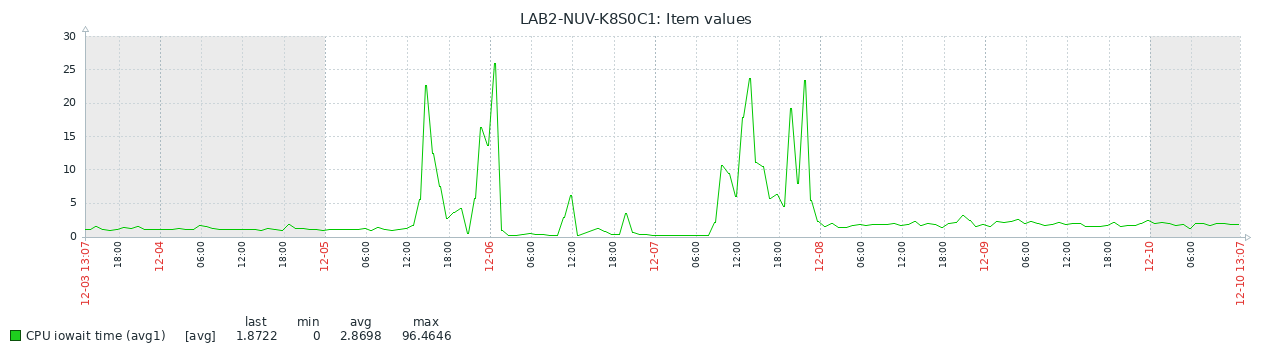
As the system by it's nature has nearly no I/O, why are we spending to much time waiting for I/O?
The reason for this has been (despite the fact we have no swap on these systems), kswapd0 has been eating quite some CPU (through I/O). At this point we cannot explain why, but that's been the observation.
Diagnosing the state
We've spent quite some time on the further diagnosis, as we have been sure that the origin of the issue is somewhere outside of kubernetes. We saw the memory allocation and CPU behaviour, checked the OS, hypervisor and so on.
The only thing we noticed is, disabling the kube-apiserver on a node stopped the madness.
To get the system overall more stable in the next step, we added memory limits to the api server (to avoid the pressure on the memory). Having done this, the OS itself got stable again, I/O waiting times vanished. The only thing remaining has been the kube-apiserver to keep crashing.

Enabling auditing
As the apiserver has been high on CPU and crashing through OOM, we removed the load from it by disabling kube-scheduler and kube-controller-manager and we enabled auditing
Checking out the audit logs at this point in time, the number of requests have been withing expected frequency.
So we started enabling kube-scheduler again. Doing this, the number of requests went absolutely insane and kube-apiserver has been responding to hundrets of requests per second.
So, we disabled kube-scheduler again, to keep the kube-apiserver from pressure and get it responsive.
Checking out the workload
At this point in time, it was time to consider, that something within the cluster causes the system to go into this state. Luckily, it was quite easy to find it - we just needed to reveal the deployments once and it has been clearly visible that this is probably not intended.
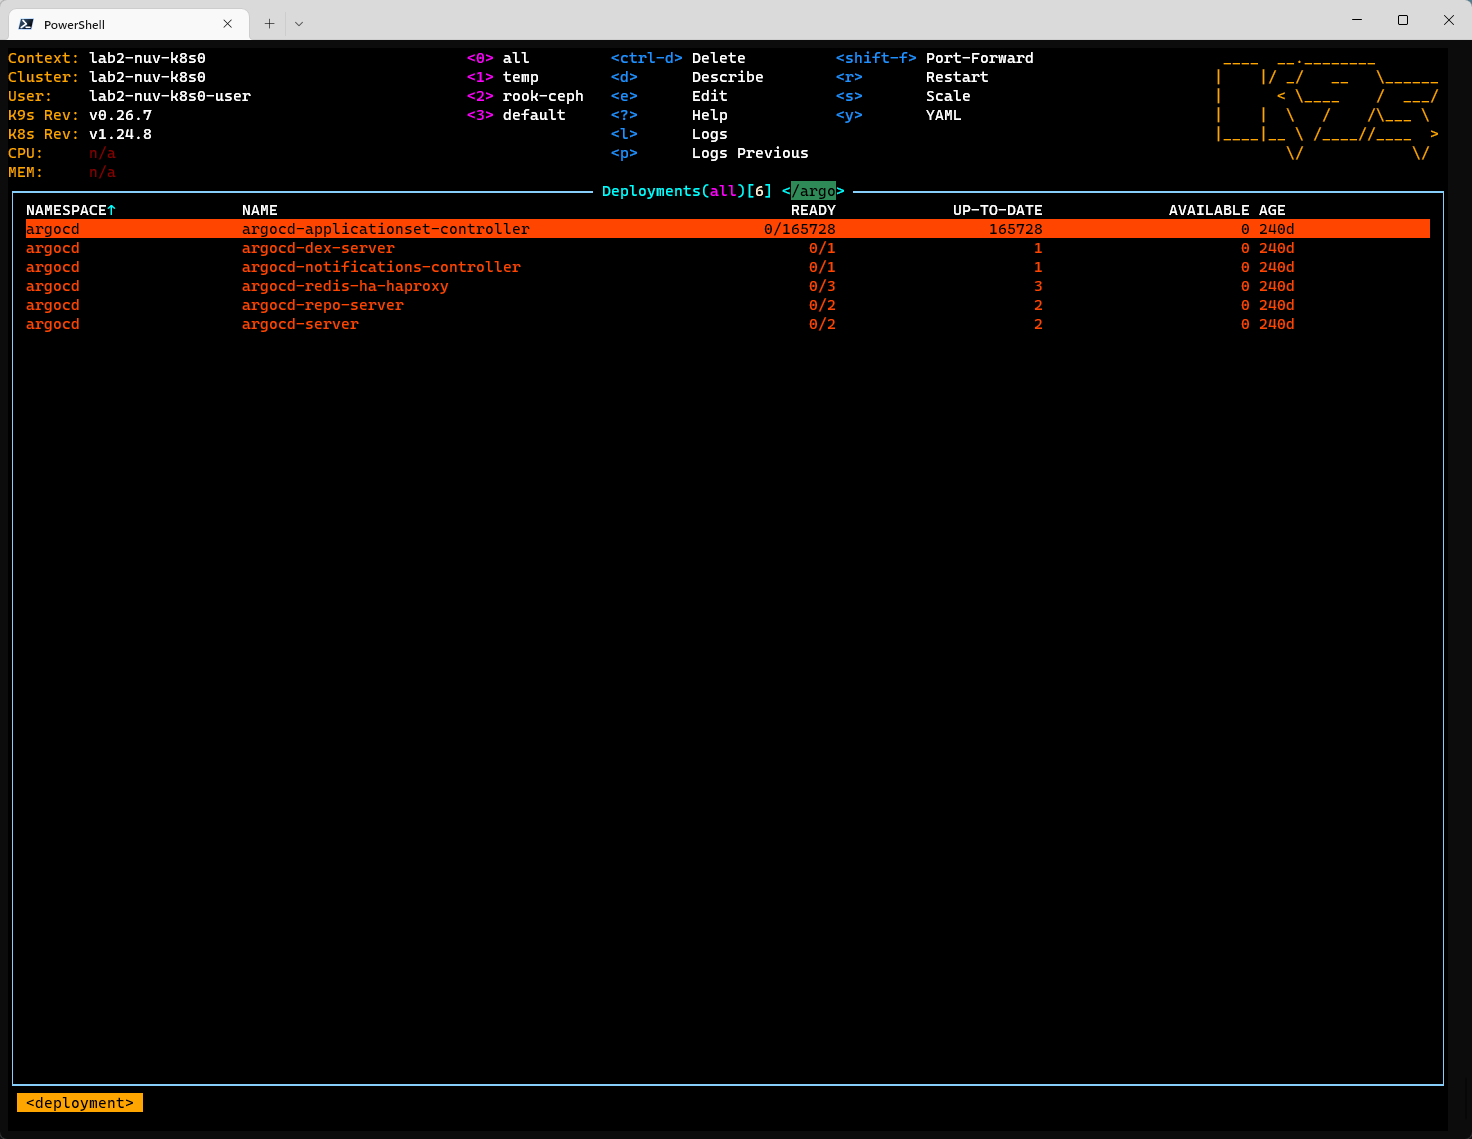
You might spot, that argocd applicationset controller has somehow a slightly increased amounf of replicas ("slightly" :-)).
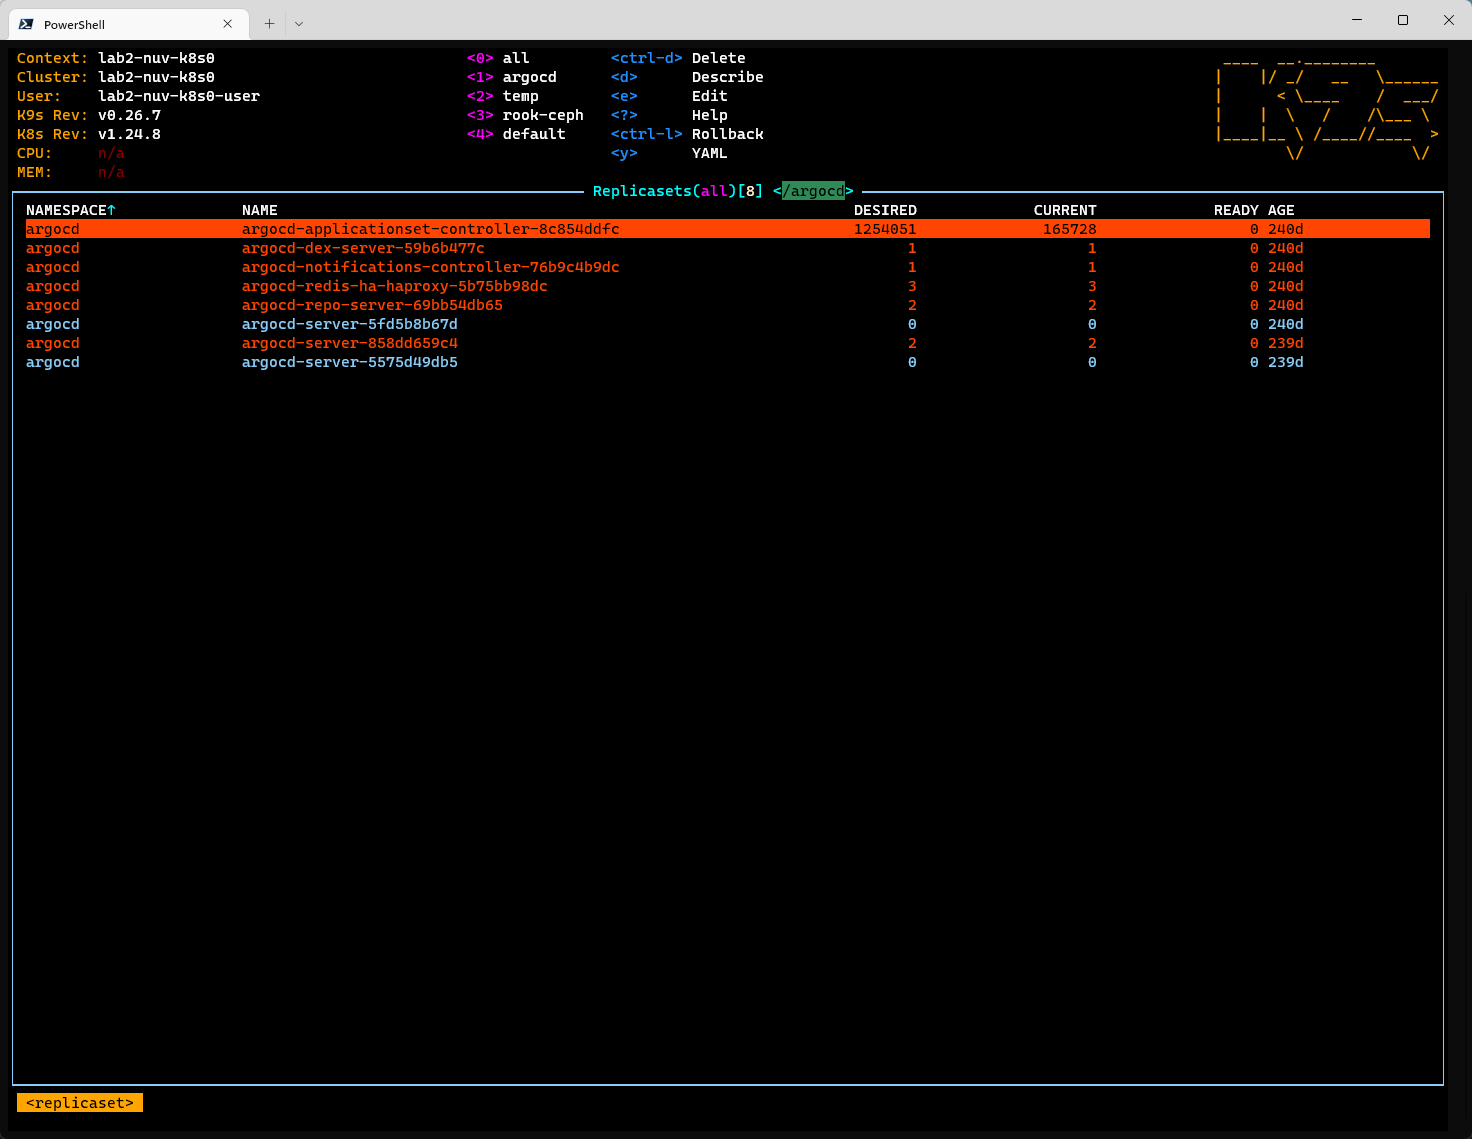
The underlying replicaset reveals that the desired amounf of replicas is even higher (1254051 to be exact) - but "only" 165728 pods have been created.
The origin of this quite sure a non-technical error I would guess :-)

Fixing it - part one
Like in most incidents, knowing what the issue is, helps to solve it. This applies also in this case.
So, we started to recover:
- Reducing the replicas in the deployment
- Deleting the replicaset
This has been working. Unfortunately - it still didn't work out. Why? Yes, the scheduler needs to be started to add or remove the pods. Sadly, starting it didn't recover the system - we didn't have the replicaset anymore, but the pods (seemingly) remained.
Fixing it - part two - entering etcd
At this state, we knew that the apiserver will not be able to recover itself. Just enumerating the pods on startup (or first watch/list request) will keep it from entering into OOM state. The solution was to directly fix it in etcd.
To make sure we are able to select all pods of the replicaset (easily through the shared key prefix), we used etcdctl.
ETCDCTL_API=3 etcdctl --cert /etc/kubernetes/pki/etcd/peer.crt --key /etc/kubernetes/pki/etcd/peer.key --cacert /etc/kubernetes/pki/etcd/ca.crt --endpoints=https://10.57.23.10:2379 get --prefix /registry/pods/argocd --keys-only=true --command-timeout=300s | grep 8c854ddfc | wc -l
= 165878So, this is exactly matching the number of pods shown in the counter of the replicaset. Great.
It's time to get serious and delete these pods.
ETCDCTL_API=3 etcdctl --cert /etc/kubernetes/pki/etcd/peer.crt --key /etc/kubernetes/pki/etcd/peer.key --cacert /etc/kubernetes/pki/etcd/ca.crt --endpoints=https://10.57.23.10:2379 del --prefix /registry/pods/argocd/argocd-applicationset-controller-8c854ddfc --command-timeout=600s Having delete all pods associated with the replicaset, we started the control plane again. And it worked like nothing had ever happened.
Lesson learned
Beside the fact that this incident shows clearly how easy it is to bring kubernetes into a quite troublesome state, it also shows how much options you have to recover it.
As it's a lab system we didnt' have much pressure on fixing it. If it would have been production, this would have been much more of a deal as coming to a point that the origin is a deployment requesting an insane amounf of replicas is not the thing we started looking at the first place.
How to prevent this?
This is just one of many ways how you can bring down your system. The underlying reason is that the kube-apiserver allocates memory for each object (quite obviously) and deployments or statefulsets are a very easy way to create a huge amount of these without ingesting them through api.
If you want to build a solution that prevents this, check out OPA gatekeeper for example or think of custom webhooks that validate the spec before storing it. So you can apply limits to the number of replicas (I would guess you will only need a very high amount [more than 128 for example] of replicas in most situations).